Modern IQ standard score
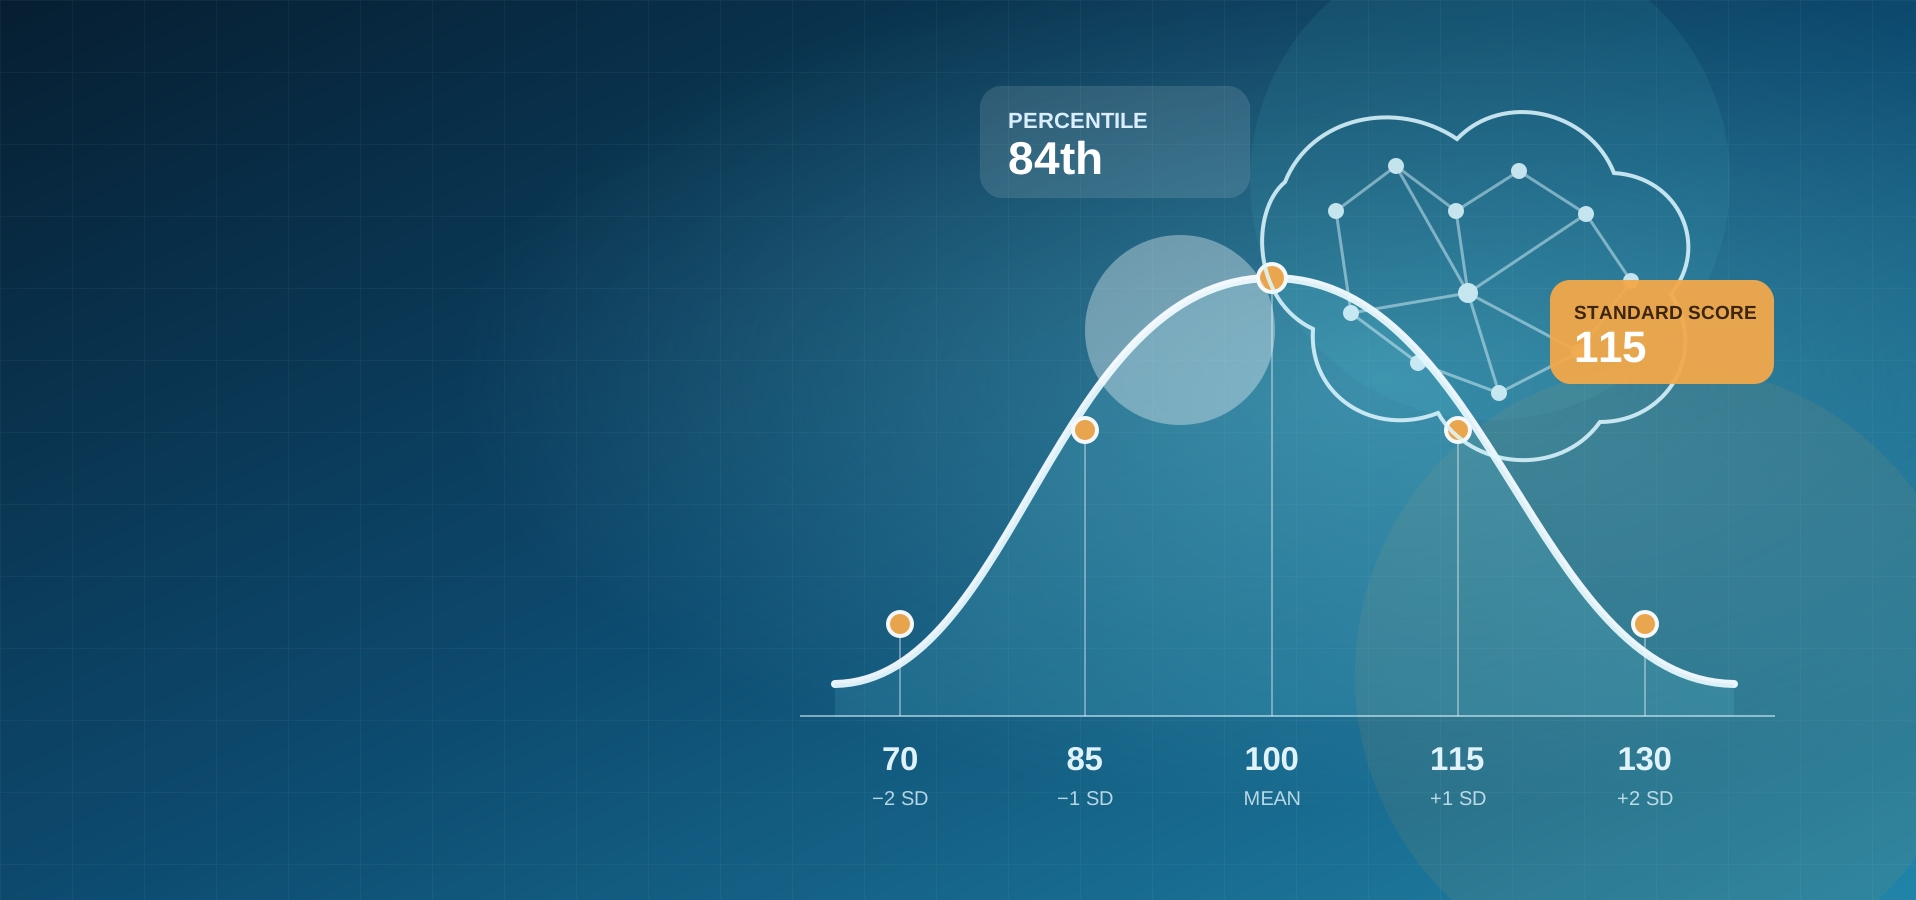
Mean 100 and standard deviation 15. This is the most common convention for contemporary Wechsler, Stanford–Binet and many other cognitive composites.
+2 SD = 130
The complete score reference
The ultimate practical guide to IQ ranges, percentiles, standard deviations, score conversions, confidence intervals, major test families, history, fairness and what a score can—and cannot—mean.
An IQ score is usually a norm-referenced standard score. It describes how performance on a standardized set of cognitive tasks compares with an age-based reference group. On the most common modern scale, the mean is 100 and the standard deviation is 15.
The number is not a percent correct, a fixed quantity of intelligence or a direct measure of a person’s worth. A professional report should identify the exact test and edition, the normative group, percentile rank, confidence interval, validity considerations and the pattern of broad and narrow scores.
This guide explains score systems and responsible interpretation without reproducing secure test items, answer keys or protected administration rules.
Last updated: August 2026
Enter a score and choose the scale printed on the report. The calculator estimates its z score, percentile, rarity and equivalent values on several common standard-score systems.
Descriptive labels are conventions, not diagnoses. Publishers and professionals may use different names, cut points or confidence-interval rules. The actual report is the authority for the score it contains.
| IQ range | Approximate z score | Approximate percentile | Common wording | Interpretive note |
|---|---|---|---|---|
| 130 and above | +2.00 or higher | About 98th and above | Very high / extremely high | Roughly the highest 2% on a mean-100, SD-15 scale. |
| 120–129 | +1.33 to +1.93 | About 91st–97th | High / very high | Well above the normative mean. |
| 110–119 | +0.67 to +1.27 | About 75th–90th | High average | Above the middle half of the reference group. |
| 90–109 | −0.67 to +0.60 | About 25th–73rd | Average | The broad central band used by many reports. |
| 80–89 | −1.33 to −0.73 | About 9th–23rd | Low average | Below the central band, but not a diagnosis. |
| 70–79 | −2.00 to −1.40 | About 2nd–8th | Very low | Interpret with confidence intervals, adaptive functioning and context. |
| 69 and below | Below −2.00 | About 2nd and below | Extremely low | An IQ score alone cannot establish intellectual disability. |
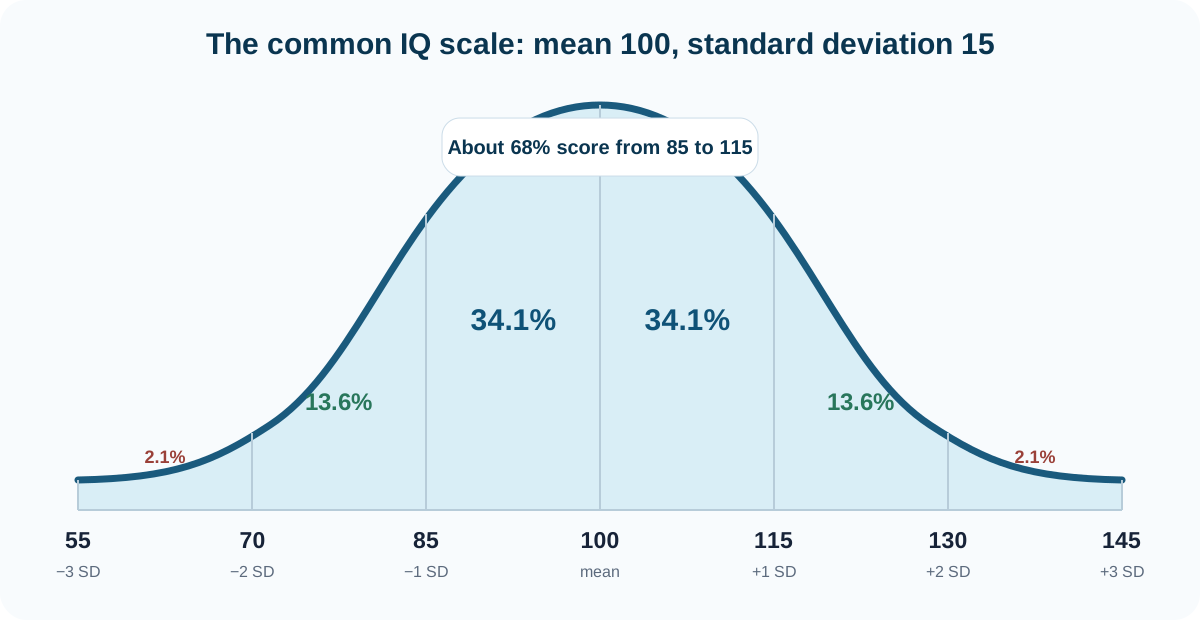
About 68% of a normal distribution falls within one standard deviation of the mean: roughly IQ 85–115.
About 95% falls within two standard deviations: roughly IQ 70–130.
About 99.7% falls within three standard deviations: roughly IQ 55–145.
A percentile rank tells you the percentage of the normative group that scored at or below a result. It is not an equal-interval scale: the difference between the 50th and 60th percentiles is not psychometrically equivalent to the difference between the 90th and 100th percentiles.
| IQ (SD 15) | z score | Approximate percentile | Approximate tail rarity |
|---|---|---|---|
| 55 | −3.00 | 0.13th | About 1 in 741 at or below |
| 60 | −2.67 | 0.38th | About 1 in 261 at or below |
| 65 | −2.33 | 0.98th | About 1 in 102 at or below |
| 70 | −2.00 | 2.28th | About 1 in 44 at or below |
| 75 | −1.67 | 4.78th | About 1 in 21 at or below |
| 80 | −1.33 | 9.12th | About 1 in 11 at or below |
| 85 | −1.00 | 15.87th | About 1 in 6 at or below |
| 90 | −0.67 | 25.25th | About 1 in 4 at or below |
| 95 | −0.33 | 36.94th | About 1 in 3 at or below |
| 100 | 0.00 | 50th | The median |
| 105 | +0.33 | 63.06th | About 1 in 3 at or above |
| 110 | +0.67 | 74.75th | About 1 in 4 at or above |
| 115 | +1.00 | 84.13th | About 1 in 6 at or above |
| 120 | +1.33 | 90.88th | About 1 in 11 at or above |
| 125 | +1.67 | 95.22nd | About 1 in 21 at or above |
| 130 | +2.00 | 97.72nd | About 1 in 44 at or above |
| 135 | +2.33 | 99.02nd | About 1 in 102 at or above |
| 140 | +2.67 | 99.62nd | About 1 in 261 at or above |
| 145 | +3.00 | 99.87th | About 1 in 741 at or above |
Rarity estimates assume an ideal normal distribution and are rounded. Do not use them as exact population counts or clinical thresholds.
The safest bridge between score systems is the z score. First express the original score as standard deviations from its mean; then rebuild it on the target mean and standard deviation.
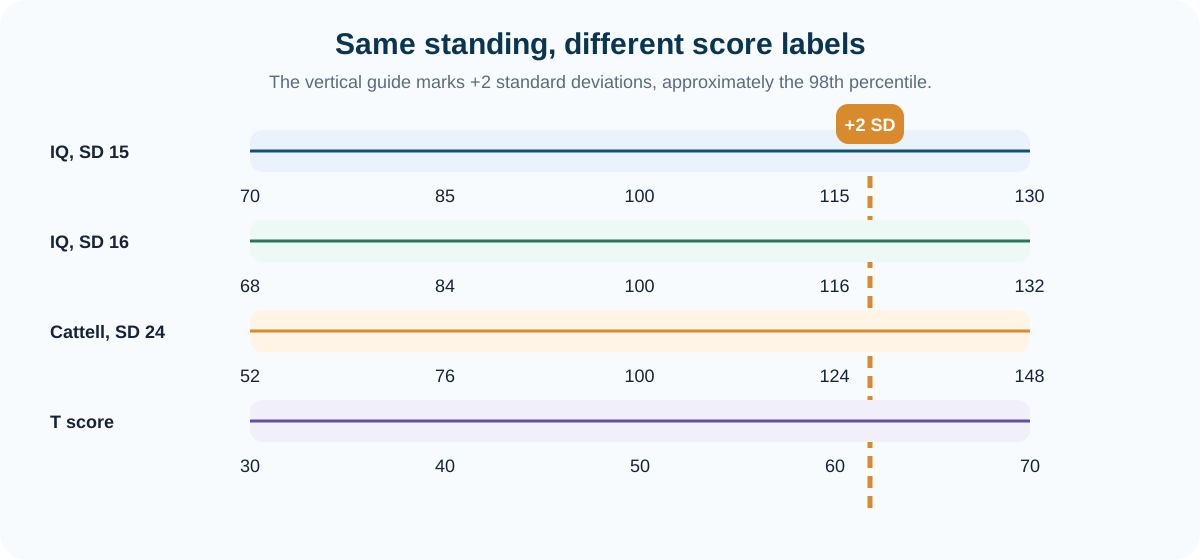
A score at approximately +2 SD has a z score of about 2.00. That becomes 130 on an SD-15 IQ scale, 132 on an SD-16 IQ scale, 148 on an SD-24 Cattell-style scale and 70 on a T-score scale.
This is why a larger number does not necessarily indicate a higher percentile. The scale’s spread determines the printed value.
Mean 100 and standard deviation 15. This is the most common convention for contemporary Wechsler, Stanford–Binet and many other cognitive composites.
+2 SD = 130Some historical tests and older tables use a standard deviation of 16. A score must be interpreted with the test name and edition.
+2 SD = 132A wider scale sometimes seen in older high-IQ contexts. The same percentile produces a much larger-looking number.
+2 SD = 148A standard-score system used widely in psychology. The mean is 50 and each 10 points equals one standard deviation.
+2 SD = 70Many individually administered cognitive subtests use a mean of 10 and standard deviation of 3 before they are combined into composites.
+2 SD = 16The universal statistical scale. A z score says how many standard deviations a score is above or below the mean.
+2 SD = z 2.00Read an IQ result as one part of an assessment argument. The score should answer a real question—such as educational planning, diagnostic clarification or documentation—and should be integrated with history, observations, other tests and everyday functioning.
Record the exact battery, edition, language, age norms and date of administration.
Review engagement, standardization, accommodations, health, attention, language and sensory access.
Interpret the confidence interval, not only the single obtained score.
Compare overall, index and subtest patterns without overinterpreting small differences.
Ask whether the findings fit school, work, communication and daily functioning.
Prioritize practical recommendations, supports and follow-up questions.
No obtained score is perfectly precise. A clinician uses the test’s standard error of measurement to create a confidence interval. For illustration, if an IQ of 100 had a standard error of 3 points, an approximate 95% interval would be about 94–106. The actual standard error varies by test, score and age.
Relatively even performance around the mean.
Large strengths and weaknesses can make a single overall number less representative.
The profiles above are invented examples for explanation only and are not based on real test records.
“IQ test” is an umbrella term. Different batteries vary in age range, length, theory, language demands, administration method, score structure and intended use. A score should never be detached from the instrument that produced it.
Individually administered age-based batteries that typically report an overall composite plus domain and subtest scores.
A broad individual intelligence battery descended from the Binet–Simon tradition, with verbal and nonverbal routes to major factor and full-scale scores.
Flexible batteries organized around broad and narrow cognitive abilities, often integrated with academic achievement evaluation.
Child-focused or brief measures that can emphasize processing, acquired knowledge, nonverbal performance or efficient screening.
Reduce spoken-language demands and focus more heavily on visual reasoning, patterns or nonverbal problem solving; “nonverbal” does not mean culture-free.
Administered to many students at once for screening or program decisions. They are not automatically interchangeable with an individual clinical IQ assessment.
Understanding cognitive strengths and needs alongside achievement, classroom evidence and intervention history.
Contributing evidence to local program criteria, often with achievement, creativity or teacher data.
Describing a cognitive profile within broader neurodevelopmental, psychiatric, neurological or medical assessment.
Supporting decisions when combined with functional evidence and the receiving organization’s requirements.
Studying cognitive development, group patterns, intervention effects and relationships with other outcomes.
Helping a person understand a profile when the assessment has a clear purpose and qualified interpretation.
The history is both scientifically influential and ethically complicated. Intelligence testing grew from efforts to identify educational needs, then became entangled with mass classification, eugenics, immigration policy and racial hierarchy. Modern practice must acknowledge that history while applying stronger standards for validity, fairness and responsible use.

Francis Galton measured sensory acuity, reaction time and physical characteristics in an early effort to quantify individual differences.
James McKeen Cattell used the phrase “mental tests” for a battery emphasizing sensory and motor performance.
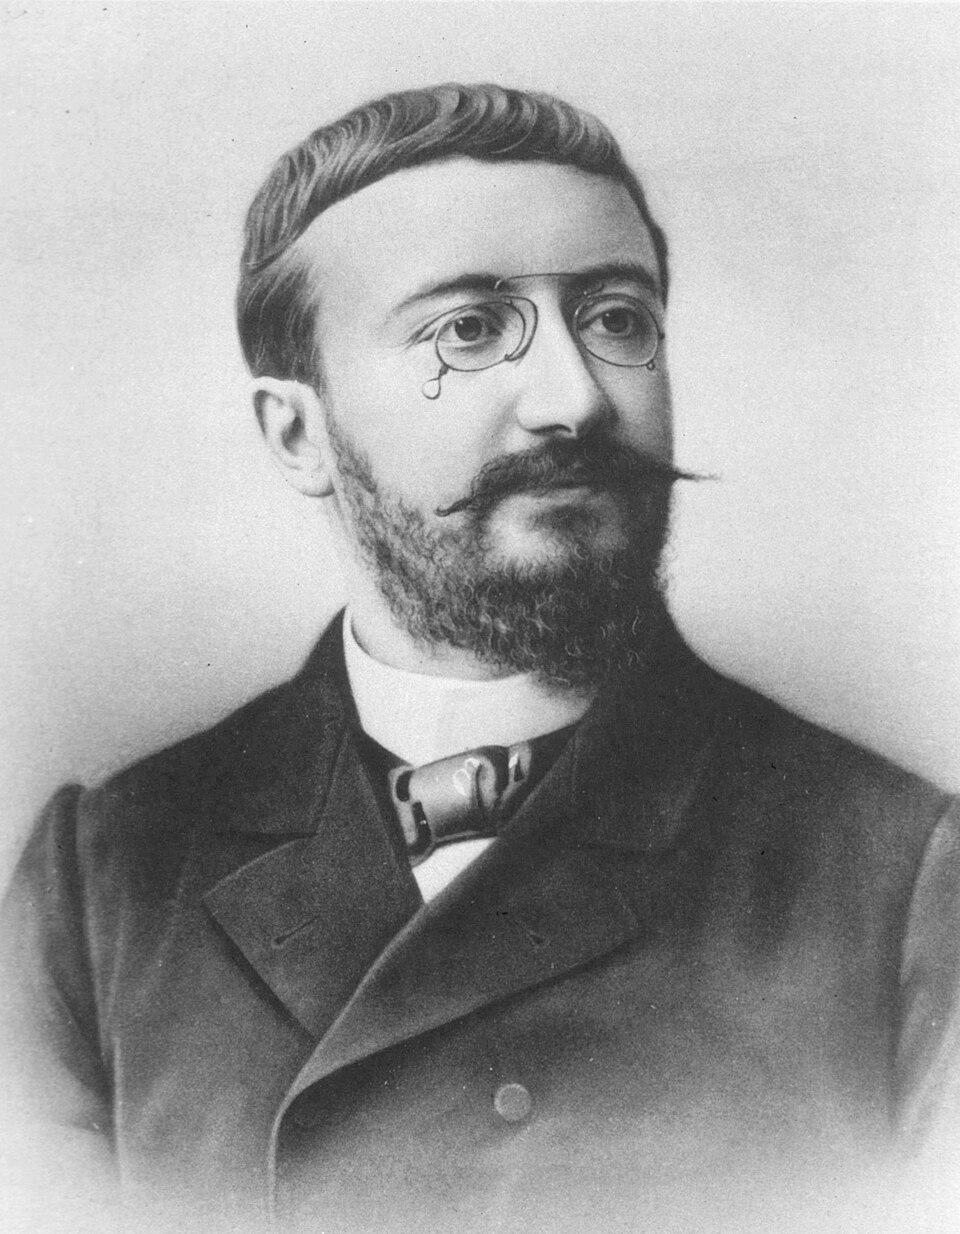
Alfred Binet and Théodore Simon published a practical set of tasks for identifying children who might need educational support. It did not yet produce the modern deviation IQ.
Revisions organized tasks by the ages at which children typically succeeded, supporting the idea of a mental-age estimate.
William Stern described a quotient relating mental age to chronological age; later users multiplied the ratio by 100.
Lewis Terman adapted and standardized the Binet–Simon approach for the United States, helping popularize the term IQ.
Group tests were used at unprecedented scale during World War I, demonstrating administrative reach while also exposing major language, education and fairness problems.
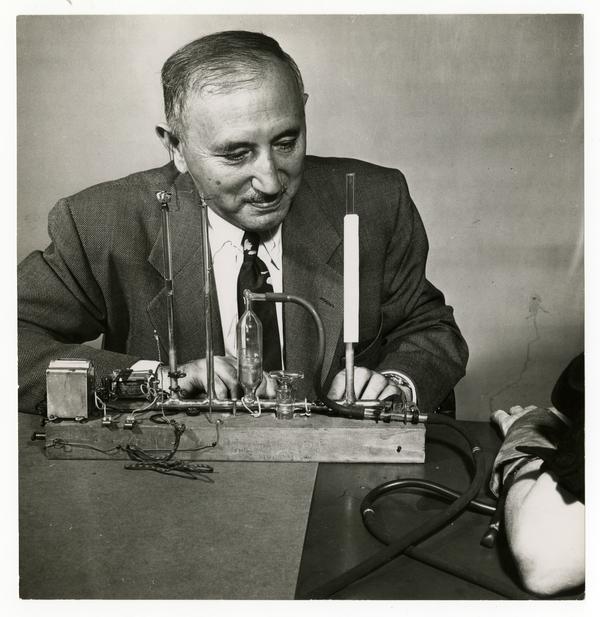
David Wechsler introduced an adult battery that compared performance with age peers and combined several task types rather than relying on ratio IQ.
James Flynn’s work drew attention to generational changes in test performance and the problem of aging norms.
Modern interpretation emphasizes current norms, multiple cognitive domains, confidence intervals, fairness, adaptive functioning and the intended use of the score.
Fair testing is not achieved by pretending context does not exist. It requires evidence that score interpretations are valid for the intended use and the examinee, plus careful attention to access, language, opportunity, disability, administration and consequences.
Severe tiredness can reduce attention, working memory, speed and persistence.
Illness, pain, neurological conditions and medication effects can change performance.
Testing in a weaker language can affect instructions, verbal tasks, rapport and even nonverbal task performance.
Sensory or motor demands can lower scores unless access needs are anticipated and documented.
Test anxiety, low engagement, perfectionism or fear of failure may influence speed and accuracy.
Schooling, literacy, enrichment and familiarity with formal problem solving affect many test performances.
Knowledge, communication style and assumptions embedded in testing may not be equally familiar to every examinee.
Retesting or practice with similar material can create practice effects, especially over short intervals.
Interruptions, poor technology, time pressure, examiner behavior and nonstandard administration can matter.
Some accommodations improve access while preserving the intended construct; others change the task enough that standard norms may no longer apply cleanly. A report should document what changed, why it changed and how the modification affects interpretation.
There is no universal “gifted IQ.” Many programs use thresholds near the upper few percentiles, but local definitions, accepted tests, age limits, score recency, confidence intervals and required supporting evidence vary. Mensa uses the upper 2% on an approved, properly administered and supervised test rather than one universal IQ number.
AAIDD defines intellectual disability through significant limitations in both intellectual functioning and adaptive behavior, originating during the developmental period. An obtained IQ near or below 70 may prompt careful evaluation, but diagnosis cannot be made from that number alone.
Online delivery is not automatically invalid, and in-person delivery is not automatically excellent. The key questions are standardization, norms, security, identity, environment, accessibility, reliability, validity and appropriate interpretation.
A percentile is a rank within a normative group. The 75th percentile does not mean 75% of items were answered correctly.
The scale, norms, edition, confidence interval and construct coverage differ. Percentile and test name are essential.
IQ tests sample selected cognitive performances. They do not fully measure creativity, wisdom, practical judgment, motivation, character or expertise.
Life outcomes depend on many personal, social, educational, health and opportunity factors beyond test performance.
Diagnosis requires limitations in both intellectual functioning and adaptive behavior with developmental-period onset.
They reduce language demands, but familiarity, education, visual experience, motivation and testing context can still affect performance.
Most online quizzes lack controlled administration, secure content, robust norms and professional interpretation.
Training on protected content threatens standardization, validity, fairness and future clinical usefulness.
Every test score includes measurement error. Reports should include a confidence interval and discuss validity.
On the most common modern scale, the normative mean is 100. A score near 100 represents performance near the center of the age-based reference group, not a percentage correct.
Many current intelligence composites use a standard deviation of 15. Some tests or historical systems use 16, 24 or another value, which is why the test name and edition matter.
On a mean-100, SD-15 normal scale, 115 is one standard deviation above the mean and is approximately the 84th percentile.
On a mean-100, SD-15 scale, 130 is two standard deviations above the mean and is approximately the 98th percentile. Exact test tables may round differently.
In the idealized normal model, yes. Official normative tables can use discrete score conversions and rounding, so a report may show a nearby percentile.
Different score systems use different standard deviations. The 98th percentile is about 130 on an SD-15 scale, 132 on an SD-16 scale and 148 on an SD-24 scale.
A z score is the number of standard deviations a result is above or below the mean. On an SD-15 IQ scale, z = (IQ − 100) ÷ 15.
It is a range around the obtained score that communicates measurement uncertainty. A 95% interval is wider than a 90% interval and should be interpreted with the test manual and referral context.
Yes. One person may have a flat profile across domains, while another has strong verbal reasoning and lower processing speed or working memory. The same overall score can summarize different patterns.
There is no universal definition. Some programs use approximately the 95th, 97th or 98th percentile; others combine ability, achievement, creativity, teacher evidence and local criteria.
Mensa describes eligibility as performance in the upper 2% on an approved, properly administered and supervised intelligence test. The qualifying number depends on the test and scale.
No. Intellectual disability requires significant limitations in intellectual functioning and adaptive behavior with onset during the developmental period. A clinician considers the score, confidence interval, validity and multiple sources of evidence.
Scores can change because of development, health, education, intervention, testing conditions, measurement error, practice effects and updated norms. The amount and meaning of change require professional interpretation.
Quality varies greatly. A well-designed online research or screening measure may estimate a narrow ability, but unsupervised quizzes generally cannot substitute for a standardized professional assessment or official documentation.
You can estimate an equivalent percentile when the original mean and standard deviation are known, but this does not correct for old norms, different constructs, score ceilings, test editions or administration conditions.
An overall IQ composite summarizes broad performance across selected tasks. Index scores summarize narrower domains such as verbal comprehension, fluid reasoning, visual-spatial ability, working memory or processing speed, depending on the test.
Normative samples contain fewer people at the far tails, score ceilings may compress performance, and a small raw-score change can produce a large standard-score difference. High and low extremes need cautious interpretation.
Only cautiously. First compare percentiles and confidence intervals, then consider the constructs measured, norms, age range, edition, administration method and purpose of each test.
Conceptual, social and practical skills used in everyday life. It is essential to intellectual-disability evaluation.
A comparison group made up of people in the same or a closely similar age range.
A standard score formed by combining performance across several subtests.
A score range that expresses uncertainty around an obtained result.
A standard score showing distance from the age-group mean, usually on a mean-100 scale.
The lowest level a test can measure with useful differentiation.
The highest level a test can measure with useful differentiation.
Full Scale IQ, an overall composite estimate of broad cognitive functioning on certain test families.
A composite representing a cognitive domain rather than the entire battery.
Reference data used to convert raw performance into interpretable scores.
The percentage of the normative group scoring at or below a result, subject to test-specific rounding.
Improvement caused by familiarity or prior exposure rather than a true change in the target ability.
The initial points or credit earned before conversion through normative tables.
The consistency or precision of scores under defined conditions.
An estimate of expected score variation caused by measurement imprecision.
Evidence supporting the interpretation and use of scores for a particular purpose.
A standardized value with mean 0 and standard deviation 1.
Use your browser’s print dialog for a clean reference copy. Interactive elements and source links are minimized automatically.
Image credits: Alfred Binet portrait and the 1917 Army testing photograph are public domain. The David Wechsler photograph is credited to New York University School of Medicine and licensed CC BY 4.0. Source and license pages are available through Wikimedia Commons.