

What is the average adult IQ?
The average adult IQ is approximately 100 by design. Modern IQ tests convert raw performance into age-normed standard scores. An adult is compared with other adults in the relevant age band—not with a child, a teenager or an unadjusted lifetime average.
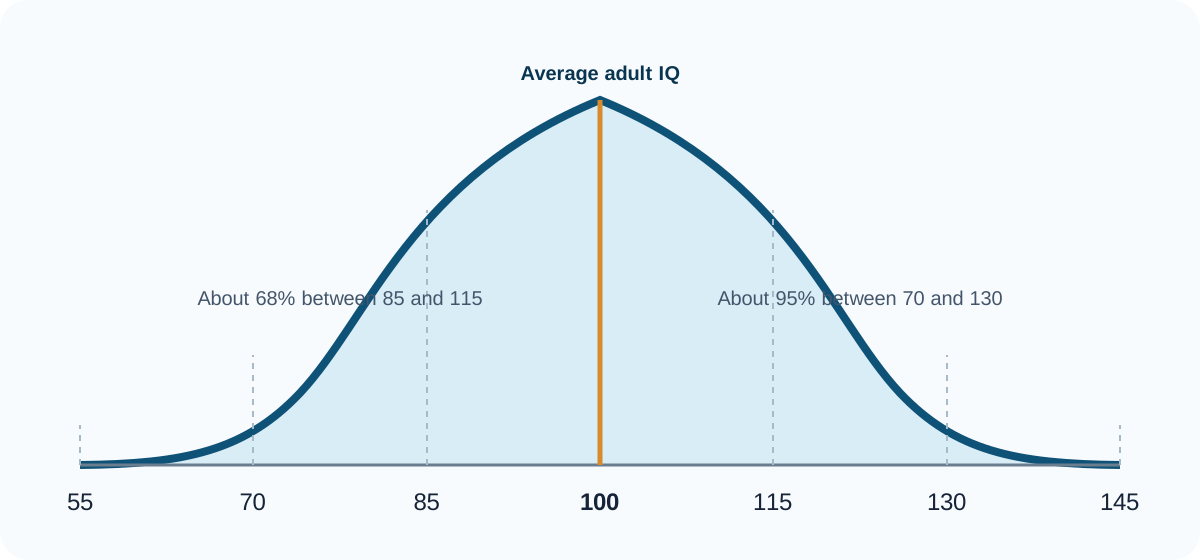
On the common mean-100, standard-deviation-15 scale, about two-thirds of people fall between 85 and 115 and about 95% fall between 70 and 130 under the idealized normal curve. A score is an estimate of performance on selected cognitive tasks; it is not a complete measure of wisdom, creativity, emotional skill, morality, practical competence or personal worth.
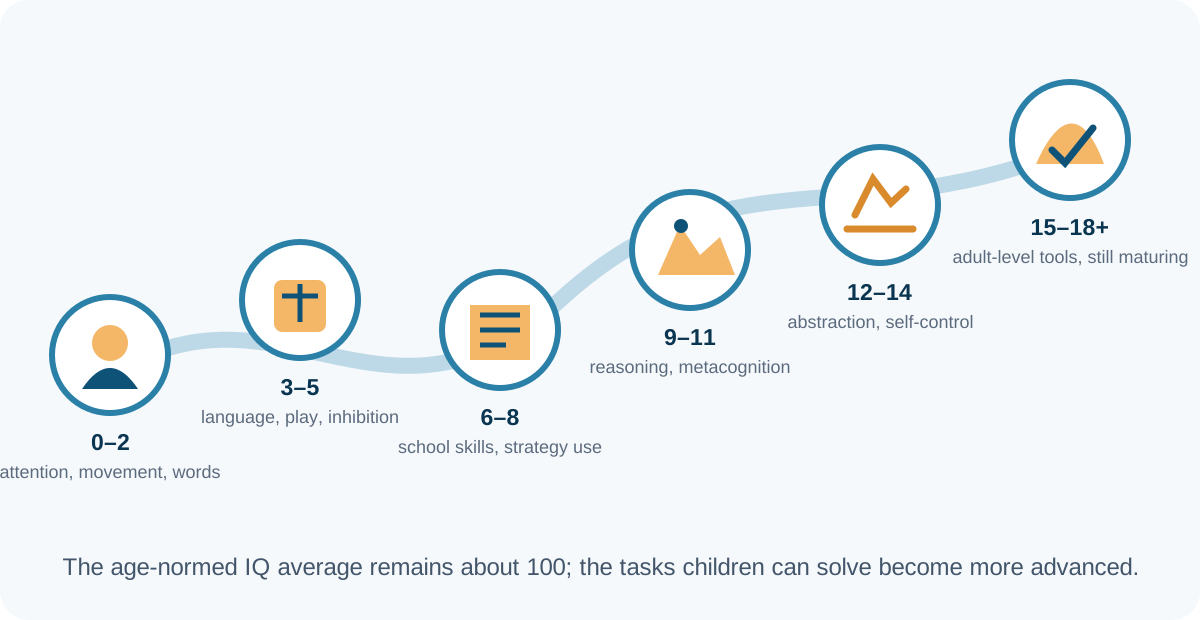
The crucial distinction: raw cognitive abilities change with age, but age-normed IQ remains centered near 100 at each age.
Last updated: August 2026
100Age-normed adult meanThe center of the comparison group
15Common standard deviationOne SD above average is 115
68%Between 85 and 115Approximate normal-curve share
98thApproximate percentile at 130About the highest 2%
Mean, median and “average range”
Mean: the arithmetic average, usually set near 100 in the norm sample.
Median: the middle rank, also near 100 in a symmetric distribution.
Average range: a descriptive band, often 90–109 or a similar interval depending on the publisher. It is wider than one exact score.
Do not compare numbers without the test. Different tests, editions and historical scales can use different standard deviations, ceilings and labels.
| IQ range | Approximate percentile | Approximate share | Common wording | Interpretation |
|---|---|---|---|---|
| 130 and above | About 98th and above | About the highest 2% | Very high / extremely high | An uncommon score that should still be interpreted with the exact test, confidence interval and profile. |
| 120–129 | About 91st–97th | Roughly 7% | High | Clearly above the age-group mean on the tested abilities. |
| 110–119 | About 75th–90th | Roughly 16% | High average | Above the center of the normative distribution. |
| 90–109 | About 25th–73rd | Roughly 50% | Average | The broad central band used by many contemporary reports. |
| 80–89 | About 9th–23rd | Roughly 16% | Low average | Below the central band, but never a diagnosis by itself. |
| 70–79 | About 2nd–8th | Roughly 7% | Very low | Requires contextual interpretation and often closer examination of adaptive and academic functioning. |
| 69 and below | About 2nd and below | About the lowest 2% | Extremely low | An IQ score alone cannot establish intellectual disability. |
Labels differ by test and edition. Use the exact wording and confidence interval from the professional report.
IQ percentile and rarity calculator
Enter an SD-15 score to see an idealized normal-curve percentile and rarity estimate. The result is educational and cannot replace test-specific normative tables.
Estimated result
50thAverage range
z score0.00
RarityThe median
Distance from mean0 points
Age-normed mean100
Real scores have measurement error. At the extremes, test ceilings and norm-sample size matter greatly.
IQ and cognitive development at every child age
A child does not need a progressively higher IQ number to be developing well. The tasks become harder with age and the norms change. A typical six-year-old and a typical sixteen-year-old can both score about 100, even though the sixteen-year-old has far more advanced reasoning, language and knowledge.
Three changes happen at once
Absolute growth: the child can solve more complex problems, remember more and use richer language.
Relative rank: the IQ percentile can remain similar, rise or fall compared with same-age peers.
Profile differentiation: verbal, spatial, memory and speed abilities can develop at different rates.
Healthy development is broader than IQ. Communication, motor skills, curiosity, emotional regulation, social connection, adaptive functioning and learning opportunities all matter.
| Age | Typical IQ reference | What is evolving | How to interpret a score |
|---|---|---|---|
| Before birth | No IQ score | Rapid formation of the brain and nervous system; sensory systems, neural migration and early connectivity emerge. | The priority is healthy pregnancy and prevention of avoidable harms, not prediction of a future IQ. |
| Birth–11 months | IQ is generally not reported | Attention to faces and voices, sensory learning, movement, recognition memory and early cause-and-effect learning grow quickly. | Infant developmental measures are useful for detecting needs but have limited power to forecast a distant adult IQ for an individual. |
| 1 year | Developmental scores, not a stable adult IQ | Object permanence, imitation, joint attention, first words, motor planning and simple problem solving expand. | Large normal variation is expected. Hearing, vision, motor and language access can strongly affect observed performance. |
| 2 years | Age-normed composites may center near 100 | Vocabulary accelerates, symbolic play appears, simple sorting and memory improve, and children follow more complex directions. | Scores can be informative clinically, but rank-order stability is still lower than later in childhood. |
| 3 years | Age-normed mean ≈100 | Language, pretend play, categorization, early number concepts and inhibition become easier to observe in structured tasks. | A single score is highly sensitive to rapport, fatigue, language, attention and willingness to engage. |
| 4 years | Age-normed mean ≈100 | Working memory, visual construction, narrative language, rule use and flexible switching show noticeable growth. | Profiles begin to be more interpretable, but scores can still move meaningfully as skills and circumstances change. |
| 5 years | Age-normed mean ≈100 | School-readiness skills, phonological awareness, early numeracy, sustained attention and strategy use strengthen. | Testing can help with educational planning, but it should be integrated with classroom, language and developmental information. |
| 6 years | Age-normed mean ≈100 | Formal learning accelerates knowledge, working memory, processing efficiency and the use of taught strategies. | Individual differences become more stable than in preschool, yet meaningful change remains possible. |
| 7 years | Age-normed mean ≈100 | Children become more systematic in reading, calculation, visual analysis and multi-step problem solving. | Achievement, opportunity to learn and language increasingly shape what test performance looks like. |
| 8 years | Age-normed mean ≈100 | Working-memory capacity, selective attention, speed and metacognitive awareness continue to expand. | Profiles may reveal genuine strengths and needs, but isolated subtest differences are often common. |
| 9 years | Age-normed mean ≈100 | More complex reasoning, planning, mental calculation and comprehension become reliable across longer tasks. | Cognitive rank order is increasingly stable, especially when testing conditions and health are comparable. |
| 10 years | Age-normed mean ≈100 | Children coordinate multiple pieces of information, use deliberate memory strategies and understand more abstract relationships. | A score describes current performance relative to same-age peers, not a fixed ceiling on learning. |
| 11 years | Age-normed mean ≈100 | Reasoning and self-monitoring improve while puberty creates wide variation in biological maturity, sleep timing and emotion. | Same-age children can differ substantially in maturity without one being globally more intelligent. |
| 12 years | Age-normed mean ≈100 | Abstract reasoning, working memory and the ability to compare hypothetical possibilities continue developing. | Motivation, school engagement, anxiety and sleep can produce noticeable day-to-day effects. |
| 13 years | Age-normed mean ≈100 | Adolescents handle more complex concepts, but executive control and reward-sensitive decision making are still maturing. | High reasoning ability does not guarantee adult-level judgment, organization or emotional regulation. |
| 14 years | Age-normed mean ≈100 | Planning, inhibition, mental manipulation and rapid integration of information become more efficient. | Profile differences may narrow or widen as education, interests and health interact with development. |
| 15 years | Age-normed mean ≈100 | Many reasoning abilities approach adult levels; complex working memory and self-directed learning continue to improve. | Extremely high scores may be limited by test ceilings, and interpretation should use confidence intervals. |
| 16 years | Age-normed mean ≈100 | Older-adolescent and adult batteries may both be possible depending on the test, referral question and local rules. | Test choice in overlapping age ranges requires professional judgment. |
| 17 years | Age-normed mean ≈100 | Cognitive control, future planning and integration of knowledge continue toward adult patterns. | Relative intellectual standing is often fairly stable, while health, education and life experience still matter. |
| 18 years | Age-normed mean ≈100 | Legal adulthood does not mark the end of brain development; executive systems and expertise continue changing into the twenties. | Adult IQ remains an age-referenced comparison, not a raw “amount of intelligence.” |
How stable is childhood IQ?
Stability is lowest in preschool, increases rapidly through childhood and is generally stronger from later childhood onward. That is a statement about average rank-order stability across groups—not a promise that any one child’s score will remain unchanged. Language acquisition, schooling, illness, sensory access, attention, trauma, intervention, test choice and measurement error can all matter.
Avoid permanent labels from early scores. A preschool score can guide support, but it should not be used to cap expectations, intensify pressure or define the child’s identity.
Evidence: 2024 meta-analysis of cognitive-ability stability and national working-memory development trends.
Child IQ 110 vs adult IQ 110: the correct age perspective
On a properly age-normed test, a child with IQ 110 and an adult with IQ 110 have approximately the same relative standing: both are around the 75th percentile among people their own age. The numbers match as ranks, but the child and adult do not have the same absolute knowledge, language, working-memory capacity, planning maturity or life experience.
Same relative rank
Different absolute maturity
Percentile position
Both people performed better than roughly three-quarters of their own age group on the abilities sampled by that test.
Task difficulty and maturity
The child receives age-appropriate items. The adult version requires more developed vocabulary, acquired knowledge, attention, speed and complex reasoning.
No valid score conversion
There is no defensible formula that turns a child’s 110 into an “adult IQ 104,” or an adult’s 110 into a “child IQ 114.” Those would be invented numbers.
How the same IQ 110 can look at different ages
| Age group | Relative meaning of IQ 110 | Typical thinking compared with an adult | Adult-equivalent IQ? |
|---|---|---|---|
| 3–5 years | About the 75th percentile among preschool-age peers. | Often learns age-level patterns and language quickly, but thinking remains strongly tied to concrete experience, play and limited working-memory capacity. | None. An adult score cannot be inferred. |
| 6–8 years | Above-average performance among early school-age children. | Can reason well with age-appropriate words, numbers and visual patterns. An adult still has much broader knowledge, sustained attention and planning ability. | None. The same percentile is the only clean comparison. |
| 9–11 years | Above about three-quarters of same-age children. | More systematic problem solving and deliberate memory strategies are emerging, while adult-level abstraction, expertise and self-management remain ahead. | None. Do not convert it to 102, 104 or another adult number. |
| 12–14 years | High-average standing among early adolescents. | Can handle increasingly abstract and hypothetical problems, but executive control, judgment, emotional regulation and accumulated knowledge are still developing. | None. Relative rank is comparable; absolute maturity is not. |
| 15–17 years | High-average standing among older adolescents. | Many structured reasoning skills approach adult levels, although experience, vocabulary, long-range planning and consistency may continue growing into the twenties. | No direct conversion. At overlapping test ages, the examiner selects an appropriate battery. |
| Adult | About the 75th percentile among adults in the relevant age band. | High-average adult performance, interpreted within an adult test’s task range and age norms. | IQ 110 in adult norms. |
What would happen in the example you described?
Valid interpretation
- A ten-year-old with IQ 110 is approximately as unusual among ten-year-olds as an adult with IQ 110 is among adults.
- The adult will ordinarily solve more difficult raw tasks because the adult has had more development, education and experience.
- The child can remain at IQ 110 while making enormous real gains from year to year, because each new age norm expects more.
Invalid interpretation
- An adult taking a child battery may reach its ceiling; that does not produce a meaningful “child IQ 114.”
- A young child taking an adult battery may earn fewer raw points, but the result is outside the proper norms and cannot be called “adult IQ 104.”
- Subtracting or adding IQ points for age confuses relative rank with absolute cognitive development.
The useful translation is percentile-for-percentile. Child IQ 110 ≈ adult IQ 110 in relative standing. Their real-world thinking differs because the tests, expected skills and developmental stage differ.
Historical “mental age” thought experiment
Early ratio-IQ systems used mental age ÷ chronological age × 100. In that old framework, a ten-year-old performing like the average eleven-year-old would receive 110. Modern tests largely replaced this method with deviation IQ because cognitive growth is uneven across abilities and does not continue as a simple linear “mental age” into adulthood. The historical formula therefore cannot supply a valid child-to-adult IQ conversion.
Further reading: Pearson describes WISC composite scores relative to same-age peers; the APA Dictionary of Psychology explains the historical mental-age ratio.
Average IQ through adulthood: decade by decade
Age-normed adult scores remain centered around 100, while the underlying mix of abilities changes. Different mental skills peak at different times; there is no single birthday when “intelligence starts declining.”
| Age band | Age-normed mean | Fluid abilities | Crystallized abilities | Practical interpretation |
|---|---|---|---|---|
| 18–24 | ≈100 | Many speeded and novel-reasoning abilities are near their lifetime high. | Knowledge and vocabulary continue accumulating rapidly. | Sleep loss, substance use, mental health, education and test familiarity can strongly affect performance. |
| 25–34 | ≈100 | Some abilities plateau; certain speeded measures can begin very gradual decline. | Professional knowledge, vocabulary and strategic skill generally expand. | The overall age-normed IQ mean stays 100 because adults are compared with age peers. |
| 35–44 | ≈100 | Processing speed may be modestly slower than in the twenties, often without noticeable daily impairment. | Knowledge, judgment in familiar domains and vocabulary are often strong. | Experience and efficient strategies can compensate for small speed changes. |
| 45–54 | ≈100 | Novel multi-step reasoning and working memory may require a little more time. | Accumulated knowledge and expertise can remain stable or improve. | Cardiovascular, metabolic, sensory and sleep health become increasingly relevant. |
| 55–64 | ≈100 | Average declines become more visible on speed, divided attention and unfamiliar problem solving. | Vocabulary and world knowledge are commonly preserved. | Age-normed scores correct for typical change; large within-person decline still deserves attention. |
| 65–74 | ≈100 | Slower processing and less efficient retrieval are common; learning may take more repetitions. | Knowledge, language and practiced expertise can remain substantial strengths. | Vision, hearing, medication, pain, depression and sleep should be considered in testing. |
| 75–84 | ≈100 | Average variability increases; speed, working memory and episodic memory are more vulnerable. | Well-learned knowledge is often relatively resilient, though not immune to disease. | Dementia is not normal aging; functional decline or rapid change warrants clinical evaluation. |
| 85+ | ≈100 on age-normed tests | There is wide diversity—from major impairment to “super-agers” with unusually preserved abilities. | Knowledge may remain useful when retrieval and sensory access are supported. | Norm samples at the oldest ages can be smaller, and health/context become especially important. |
Genius outliers and exceptionally high IQ
“Genius” is a cultural label, not a standardized diagnosis. A high IQ indicates unusual performance on the abilities sampled by the test. It does not establish exceptional creativity, wisdom, achievement, motivation or mental health.
IQ 130
+2 SD
97.7th percentile
About 1 in 44 at or above
A common operational threshold for the upper 2%, but not a universal definition of giftedness or genius.
IQ 145
+3 SD
99.865th percentile
About 1 in 741 at or above
Extremely uncommon; measurement error and test ceilings become increasingly important.
IQ 160
+4 SD
99.9968th percentile
About 1 in 31,600 at or above
Often beyond the well-measured range of standard batteries; exact estimates should be treated cautiously.
What gifted outliers can look like in childhood
Possible strengths
- Rapid learning and strong memory for preferred material
- Advanced vocabulary or unusually complex questions
- Early abstraction, pattern detection or quantitative reasoning
- Intense curiosity and deep, sustained interests
- Original combinations of ideas
Possible needs
- Asynchronous development: advanced reasoning with age-typical emotions or motor skills
- Boredom, perfectionism or fear of failure
- Learning disability, ADHD or autism can coexist with high ability
- Social mismatch or pressure to perform
- Appropriate acceleration and depth rather than more repetitive work
Extreme scores are less precise. Confidence intervals widen, ceiling effects become important and tiny raw-score differences can produce large-looking score changes. Use several sources of evidence.
Does IQ lower with age—and how exactly?
What tends to change
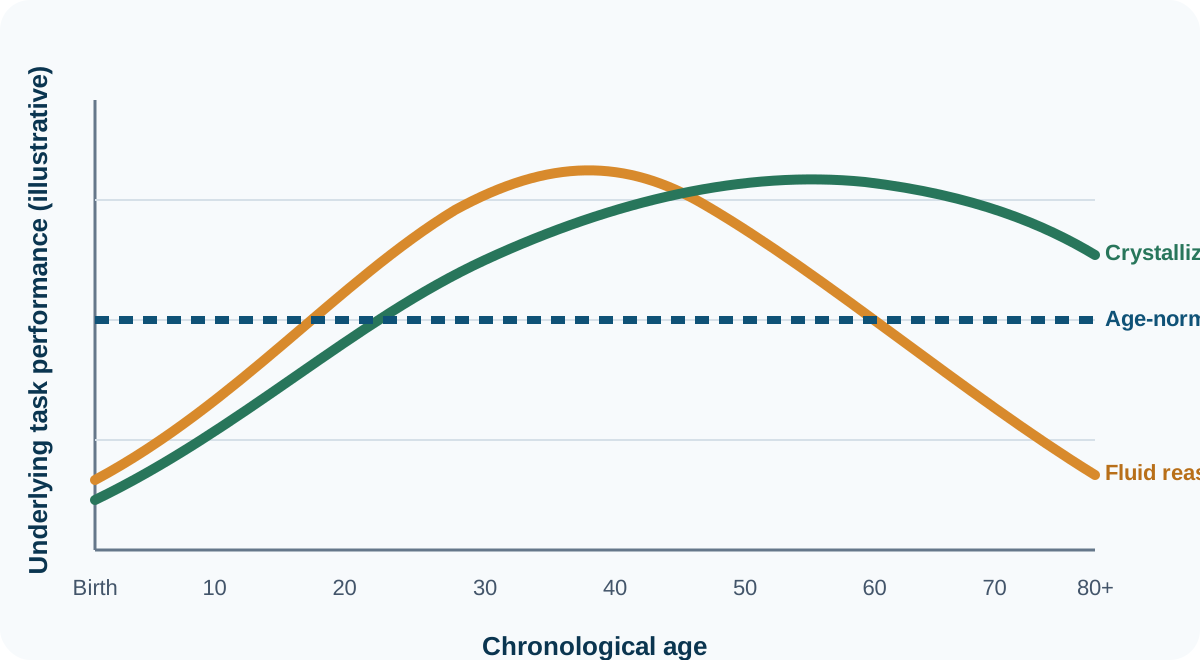
Often earlier and more vulnerable: processing speed, reaction time, divided attention, working memory under load and novel reasoning.
Often preserved longer: vocabulary, accumulated knowledge, practiced expertise and strategies.
Why the IQ may look stable: age-based norms compare an older adult with other older adults, correcting for typical age trends.
Normal aging vs. a concerning change
Often compatible with normal aging
- Needing a little more time to learn unfamiliar material
- Occasional word-finding difficulty while the word later returns
- Slower switching between multiple tasks
- Greater benefit from notes, routines and reduced distraction
- Preserved independence and judgment in daily life
Discuss with a clinician
- Rapid or progressive decline noticed by the person or family
- Getting lost in familiar places
- Repeatedly forgetting important recent events
- New difficulty managing medication, finances or safety
- Major personality, language, judgment or functional change
What can make an older adult test lower without permanent loss?
Poor sleep, depression, anxiety, pain, infection, medication effects, substance use, hearing or vision loss, unfamiliar technology, fatigue, low blood pressure, acute illness and a testing environment that is not accessible can all reduce performance. A good evaluation distinguishes longstanding ability, normal age change, temporary interference and neurological disease.
Evidence: National Institute on Aging, lifespan cognitive-peak research and longitudinal fluid/crystallized change.
Genetics of IQ: what is inherited, from which parent and with what probability?
The accurate bottom line
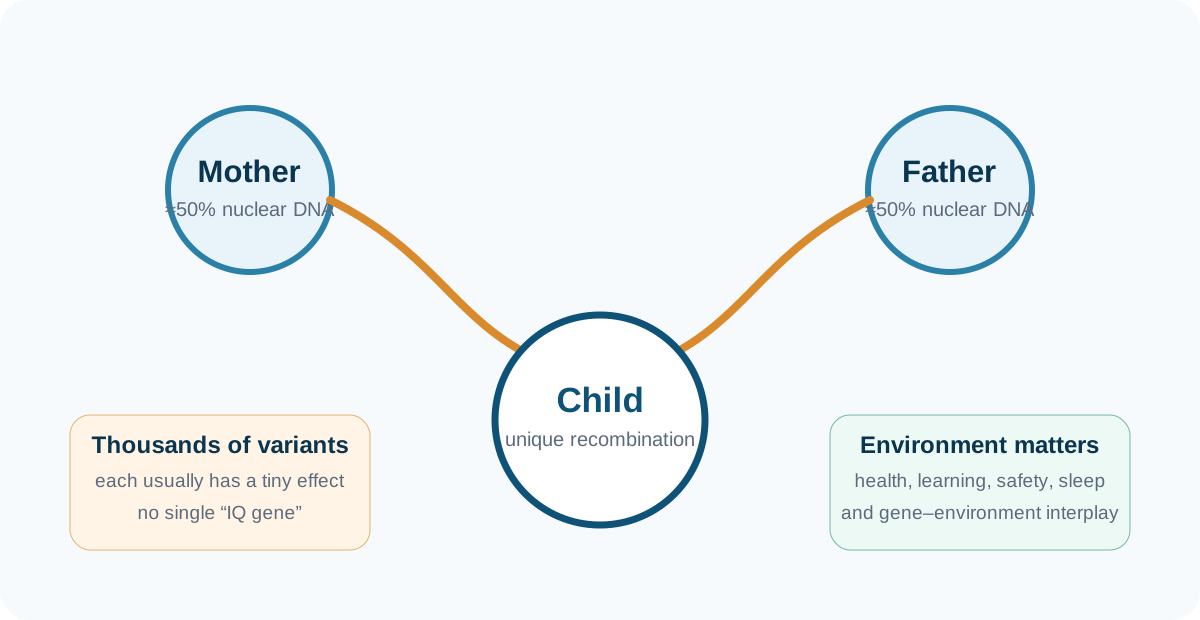
Both parents contribute: a child inherits about half of nuclear DNA from the mother and half from the father.
No single IQ gene: genome-wide studies find many loci and hundreds of associated genes, each usually contributing a tiny amount of statistical variation.
Environment is intertwined: genes can influence which experiences people seek and how they respond, while environments affect how potential is expressed.
What heritability actually means
Heritability is the share of variation among people in a particular population and environment statistically associated with genetic differences. It is not the percentage of one person’s IQ “caused by genes,” does not say which parent mattered more, and does not tell us how much an individual can change. Estimates often rise from childhood into adulthood, partly because people increasingly select and shape environments correlated with their dispositions.
Probability of transmission
Often 50% from a heterozygous parent
For a specific allele where a parent has two different copies, each child has roughly a 1-in-2 chance of receiving either copy. Each pregnancy is a new event.
No single percentage
Thousands of variants recombine, many are shared by most people, and their effects depend on ancestry, development and environment.
No general advantage
Mitochondrial DNA is maternal and sex chromosomes differ, but this does not make general intelligence primarily inherited from one parent.
Examples of genes and regions found in research
The names below are included to show the complexity of the biology—not to create a consumer gene panel. Large studies identify pathways related to neurogenesis, nervous-system development, neuronal projections and dendrites. Findings can differ across samples and ancestries.
AUTS2
A neurodevelopment-related gene repeatedly appearing in studies of cognitive and educational traits.
Common variants have tiny statistical effects; rare disruptive variants can be associated with developmental disorders.GATAD2B
Part of chromatin-remodeling biology and identified in large gene-based cognitive-function analyses.
Rare damaging variants can cause neurodevelopmental syndromes; this is not a “high-IQ gene.”SLC39A1
A zinc-transporter gene reported in large cognitive-function association analyses.
Association does not establish a simple causal pathway or allow meaningful prediction for one child.ATXN1 / related loci
Neuronal genes and regions appearing in genome-wide studies of cognition and reaction time.
Some rare variants cause neurological disease; common-variant associations are small and context-dependent.DCDC2 region
A region studied in reading, cortical development and cognitive variation.
Findings do not justify genetic selection, direct-to-consumer “IQ DNA” claims or deterministic interpretation.Do not use genetic claims to rank children or select a “desirable” person. Current polygenic predictions are incomplete, ancestry-sensitive and environmentally confounded. The history of intelligence genetics includes eugenics and scientific racism; modern use requires exceptional ethical caution.
Evidence: MedlinePlus intelligence genetics, NHGRI inheritance basics and large cognitive-function GWAS.
How to help a child develop the highest cognitive potential possible
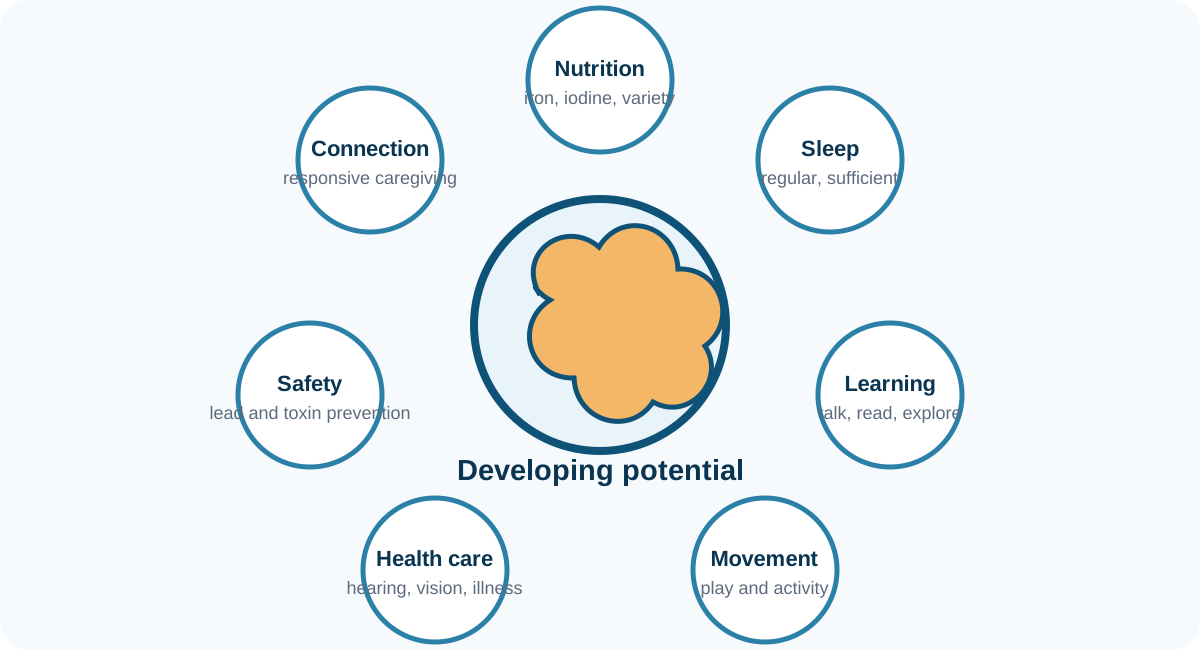
You cannot guarantee a genius IQ, and chasing a number can harm the child. The evidence-based goal is to prevent avoidable injury, meet health and learning needs, and provide a safe, responsive, stimulating environment in which the child can develop their own strengths.
Think “protect and enrich,” not “engineer”
Protect the brain from preventable hazards and untreated health problems. Enrich development through responsive interaction, language, play, education, sleep, movement and emotional security. Follow the child’s interests while maintaining balanced expectations.
The highest-value intervention is often the missing basic. Correcting hearing loss, iron deficiency, sleep apnea, lead exposure, severe stress or an unrecognized learning difficulty may matter more than any enrichment product.
Healthy pregnancy care
Prenatal care, folic acid before and during early pregnancy, adequate iodine and iron, treatment of health conditions, and avoidance of alcohol and harmful exposures protect brain development.
Adequate, varied nutrition
Correcting deficiencies such as iron or iodine can prevent avoidable developmental harm. In well-nourished children, no ordinary food or supplement reliably creates a large IQ boost.
Regular sufficient sleep
Sleep supports attention, memory consolidation, emotional regulation and executive function. Chronic sleep problems deserve assessment rather than punishment.
Language and learning
Conversation, shared reading, play, exploration, responsive questions and high-quality education build knowledge and the skills sampled by cognitive tests.
Responsive relationships
Warm, predictable caregiving and a safe home help children regulate stress and devote cognitive resources to learning.
Physical activity and health
Movement, outdoor play, cardiovascular fitness, hearing and vision care, and treatment of illness support learning and daily cognitive performance.
Prevent neurotoxic exposure
Lead exposure can lower IQ and harm attention and school performance. Follow local guidance for old paint, water, soil and occupational take-home exposure.
Manage severe or chronic stress
Not all stress is harmful, but persistent threat without supportive relationships can interfere with sleep, attention, behavior and learning. Caregiver support matters too.
Act early on difficulties
Early evaluation of hearing, language, attention, learning, motor or developmental concerns can lead to supports during periods of high plasticity.
Stage-by-stage practical plan
- Before pregnancy and pregnancy
Use prenatal care; follow folic-acid, iodine and iron guidance; avoid alcohol; review medications and workplace/home exposures with clinicians; manage diabetes, thyroid disease and infections. - Birth to age 3
Respond to signals, talk and sing, share books, allow safe movement and exploration, maintain sleep routines, monitor hearing/vision and act early on developmental concerns. - Ages 3–5
Use rich conversation, pretend play, puzzles, drawing, counting and outdoor play. Build self-regulation with predictable routines rather than performance pressure. - Ages 6–11
Support reading, numeracy, curiosity and deliberate practice. Coordinate with school when progress is unexpectedly slow or unusually advanced. - Ages 12–18
Protect sleep, mental health and belonging. Offer challenging coursework, mentors and autonomy while recognizing that executive control is still developing. - Across all ages
Model learning, ask open questions, praise effective effort and strategy, permit mistakes, and avoid comparing siblings or turning IQ into a family status symbol.
Diet and supplements: a practical hierarchy
Do
- Provide a varied diet with adequate energy, protein and micronutrients
- Use iodized salt where recommended and discuss pregnancy iodine needs with a clinician
- Screen or test for iron deficiency when medically indicated
- Follow age-appropriate fish and mercury guidance
- Treat feeding disorders and growth concerns early
- Use supplements for a documented need or professional recommendation
Avoid
- Megadose vitamins or minerals
- Unregulated “brain boosters” and nootropics for children
- Extreme restrictive diets without medical supervision
- Assuming sugar, one ingredient or one food explains a complex profile
- Using supplements instead of investigating sleep, hearing, learning or mental health
- Promising a specific IQ increase
Stress: what helps and what hurts
Brief, manageable challenges with supportive adults can build competence. The concern is severe, prolonged or unpredictable stress without adequate support. Reduce exposure to violence and chaos, keep routines, repair after conflict, obtain treatment for caregiver and child mental health, and make school a place of safety and achievable challenge.
Evidence: WHO Nurturing Care Framework, CDC lead guidance, WHO iron guidance and WHO iodine guidance.
When testing is useful—and how to get a valid answer
Learning questions
Pair cognitive testing with achievement, classroom evidence and intervention history.
Gifted planning
Use local criteria, multiple measures and an evaluation appropriate for the child’s age and language.
Neurodevelopment
IQ may contribute to ADHD, autism, language, learning or intellectual-disability evaluations but cannot diagnose them alone.
Cognitive change
In older adults, compare current performance with history, education, functioning and medical factors.
Access and accommodations
Document sensory, motor, language and disability needs and any changes to standard procedures.
Documentation
Confirm which test, edition, age limit and report format the receiving organization accepts.
Why scores can differ between tests or occasions
- Different tests sample different abilities and use different norms.
- Confidence intervals mean the “true score” is not assumed to equal one exact number.
- Sleep, anxiety, illness, medication, pain, language, motivation, rapport and sensory access matter.
- Practice effects can raise a retest score, especially over short intervals.
- Developmental change can be real, particularly in younger children.
- A broad FSIQ can hide meaningful differences among verbal, spatial, reasoning, memory and speed domains.
History of the average IQ and age norms
The idea that the adult average is 100 emerged through a shift from mental-age ratios to deviation scores. The history includes valuable advances in educational assessment and serious misuse in eugenics, immigration, segregation and racial hierarchy.


Galton and individual differences
Francis Galton promoted measurement of human differences but also advanced eugenic ideas that were scientifically flawed and ethically harmful.
Binet–Simon scale
Alfred Binet and Théodore Simon created practical tasks to identify children needing educational help. Binet warned against treating intelligence as a fixed, complete quantity.
The IQ ratio and Stanford revision
William Stern proposed an intelligence quotient based on mental age divided by chronological age. Lewis Terman’s Stanford revision helped popularize IQ in the United States.
Army Alpha and Beta
Large-scale group testing during World War I expanded psychometrics but exposed language, education, cultural and misuse problems.
Wechsler–Bellevue
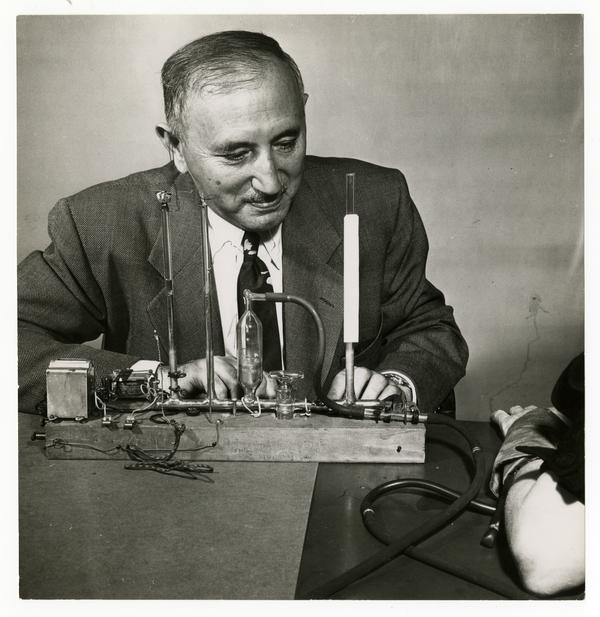
David Wechsler developed an adult battery using age-based comparisons and multiple task types, helping establish deviation IQ rather than mental-age ratio IQ.
Child and preschool Wechsler scales
The WISC and WPPSI extended age-normed, individually administered testing to children and preschoolers.
Flynn effect and newer norms
Researchers documented generational changes in test performance, reinforcing the need to revise norms rather than compare people with outdated samples.
Profiles, uncertainty and fairness
Current practice emphasizes multiple cognitive domains, confidence intervals, current norms, accessibility, adaptive functioning and cautious use of genetics.
Why ratio IQ failed as an adult scale
The historical formula divided “mental age” by chronological age and multiplied by 100. It becomes nonsensical in adulthood because cognitive growth is not linear and adult mental age does not keep increasing year-for-year. Deviation IQ solves this by comparing each person with an age-based normative distribution.
Fairness, culture and the ethics of “maximizing IQ”
IQ test performance is affected by language, educational opportunity, disability access, health, culture, socioeconomic conditions, discrimination and familiarity with testing. This does not make measurement useless; it makes careful test selection, validation and interpretation essential.
Group statistics cannot diagnose an individual. Do not use IQ averages to stereotype a person by race, nationality, gender, disability, income, neighborhood or ancestry.
Parents should never make affection, praise or belonging conditional on performance. High-pressure “optimization,” constant testing and sibling comparison can worsen anxiety, perfectionism and motivation. A child’s right to safety, play, identity and broad development is more important than producing a particular number.
Common myths about average adult IQ
“A six-year-old should have a lower IQ than an adult.”
False. The six-year-old receives age-appropriate tasks and is compared with other six-year-olds. Both age groups are centered near 100, even though the adult can solve harder raw tasks.
“IQ rises every year as the brain grows.”
Raw cognitive ability grows dramatically in childhood, but an age-normed IQ is a relative rank. A child can learn a great deal while keeping roughly the same IQ percentile.
“Intelligence comes mainly from the mother.”
Not supported. Children inherit about half their nuclear DNA from each parent, and intelligence is influenced by many variants plus environment.
“Heritability means a child’s IQ cannot change.”
False. Heritability describes variation in a population under particular conditions. It does not set an individual’s destiny or quantify how modifiable a trait is.
“A supplement can create a genius.”
No credible evidence supports this. Correct deficiencies and follow medical advice, but avoid megadoses, unregulated nootropics and products promising extraordinary IQ gains.
“Older adults simply lose intelligence.”
Too simple. Processing speed and novel problem solving often decline gradually, while vocabulary, knowledge and expertise can remain stable or improve for years.
“A very high IQ guarantees achievement.”
No. Motivation, health, personality, opportunity, creativity, social support, persistence and domain-specific training strongly shape outcomes.
“One test result is exact.”
Every score has measurement error. Confidence intervals, test conditions, prior exposure, health and the pattern of index scores matter.
Frequently asked questions
What is the average IQ for an adult?
On most contemporary individually administered IQ scales, the age-normed composite mean is set to 100, usually with a standard deviation of 15. “Average adult IQ” therefore means performance near 100 relative to adults in the same age norm group.
Is 100 exactly the average at every adult age?
In a properly normed test, each adult age band is calibrated to center near 100. The exact sample mean and score distribution can differ slightly because of rounding, weighting, edition and normative design.
What percentage of adults have an IQ between 85 and 115?
Under the idealized normal distribution used for an SD-15 scale, about 68% fall within one standard deviation of the mean, from 85 to 115. Real test distributions and reported bands may differ slightly.
Does a child’s IQ normally increase each year?
The underlying skills become much more advanced, but age-normed IQ is designed to compare the child with same-age peers. The average remains about 100 at each age. Individual scores can move as development, health, education and measurement conditions change.
At what age does IQ become stable?
There is no single cutoff. Stability is relatively low in preschool, rises rapidly through childhood, and is generally stronger from later childhood onward. Even stable rank order does not mean no individual change.
Can a toddler be reliably labeled a genius?
Extreme early development can warrant enrichment or assessment, but toddler scores are less stable and more sensitive to language, attention, motor demands and testing conditions. Avoid making a permanent identity from one early score.
What IQ is considered genius?
“Genius” is not a standardized clinical classification. Scores of 130 or 145 are sometimes used informally for very high or exceptionally high ranges, but creativity, expertise and major accomplishment cannot be reduced to a cutoff.
Does IQ decrease after age 30?
Some speeded, fluid and working-memory abilities can show gradual average decline from early or middle adulthood. Knowledge and vocabulary often remain stable or improve longer. Age-normed IQ scores compare adults with peers, so the age-group mean remains near 100.
Is a sudden IQ drop normal aging?
No. Rapid, large or functionally important decline is not explained by ordinary aging alone. Medical illness, medication, depression, sleep disorder, sensory loss, neurological disease or other causes should be evaluated.
How much of IQ is genetic?
Heritability estimates vary by age, population and environment. Twin studies often report moderate heritability in childhood and higher estimates from adolescence into adulthood, but these are population statistics—not a percentage of one person’s intelligence caused by genes.
Does intelligence come more from the mother or father?
No reliable evidence supports a general parent-of-origin advantage. A child receives about half of nuclear DNA from each parent. Mitochondrial DNA is maternal and sex chromosomes differ, but these facts do not make intelligence predominantly maternal or paternal.
What is the probability that a parent passes “high-IQ genes” to a child?
There is no small set of high-IQ genes with a simple inheritance percentage. For a particular autosomal allele, a heterozygous parent has a 50% chance of passing that allele to each child, but intelligence reflects thousands of variants, recombination, development and environment.
Can parents maximize a child’s IQ?
Parents cannot guarantee a target score. They can protect development and help a child approach their potential through healthy pregnancy care, adequate nutrition, sleep, responsive relationships, reading and conversation, quality education, physical activity, toxin prevention and early treatment of developmental or health problems.
Which food raises IQ the most?
No single food reliably raises IQ in a well-nourished child. Adequate iodine, iron, protein, essential fats and overall dietary variety are important; deficiencies should be assessed and treated with professional guidance.
Does stress lower IQ?
Acute anxiety can reduce test performance temporarily. Severe or chronic adversity can affect sleep, attention, emotion and learning. Supportive relationships and treatment can reduce harm; ordinary manageable challenge is also part of learning.
Can schooling increase IQ?
Education builds knowledge and cognitive skills and can raise performance on many cognitive measures. The size and durability of change vary, and schooling effects do not mean tests measure only taught facts.
Can exercise improve IQ?
Physical activity supports general health, mood, sleep and executive functioning. Evidence is stronger for broad cognitive and health benefits than for a guaranteed permanent increase in full-scale IQ.
Should I buy a DNA test that predicts my child’s IQ?
Current consumer predictions are not clinically reliable for individual intelligence, can be ancestry-biased, and may encourage deterministic or discriminatory decisions. Genetic testing is appropriate for specific medical questions under qualified guidance, not for selecting an IQ outcome.
Can an online IQ test tell me my real IQ?
It may provide entertainment or rough screening if it has transparent norms, but it usually cannot replace secure, standardized, individually administered testing when diagnosis, education or documentation matters.
Is intellectual disability defined by IQ below 70?
Not by IQ alone. Diagnosis requires significant limitations in intellectual functioning and adaptive behavior with developmental onset. Confidence intervals, communication, daily living and social-practical functioning are essential.
Glossary
Age norms
Reference data used to compare a person with others of approximately the same age.
Chronological age
Time since birth, distinct from biological maturity, developmental level or mental-age concepts.
Confidence interval
A range around a score that communicates measurement uncertainty.
Crystallized intelligence
Acquired knowledge, vocabulary and use of learned information.
Deviation IQ
A modern age-normed standard score, commonly with mean 100 and SD 15.
Executive functions
Control processes such as inhibition, working memory, planning and flexible switching.
Fluid intelligence
Reasoning through novel problems with limited reliance on previously learned content.
Flynn effect
Generational changes in cognitive-test performance that make updated norms necessary.
Heritability
The proportion of variation in a trait statistically associated with genetic variation in a particular population and environment.
IQ
A standardized estimate of performance on selected cognitive tasks relative to a normative group.
Normative sample
The group used to build score conversions and comparisons for a test.
Percentile rank
The percentage of the comparison group scoring at or below a score.
Polygenic
Influenced by many genetic variants, usually with very small individual effects.
Practice effect
Improvement from familiarity, remembered content or repeated exposure rather than underlying change.
Processing speed
Efficiency and accuracy on simple time-limited mental or visual tasks.
Raw score
Points earned before conversion using normative tables.
Standard deviation
A unit describing spread around the mean; on many IQ scales, one SD equals 15 points.
Working memory
Holding and mentally manipulating information over a short period.
Professional and primary sources
- National Institute on Aging — How the Aging Brain Affects Thinking Normal cognitive aging, including slower processing and preserved vocabulary/knowledge.
- National Institute on Aging — Cognitive Health and Older Adults Evidence-based brain-health and medical-risk guidance.
- Hartshorne & Germine (2015) — When Does Cognitive Functioning Peak? Large lifespan study showing that different cognitive abilities peak at different ages.
- Tucker-Drob et al. (2022) — Fluid and Crystallized Change Longitudinal evidence on fluid and crystallized cognitive trajectories.
- Breit et al. (2024) — Stability of Cognitive Abilities Meta-analysis showing low preschool stability and rapid increases through childhood.
- Haworth et al. (2010) — Heritability Across Childhood and Adolescence Large twin study of changing heritability estimates with age.
- Davies et al. (2018) — 148 Genetic Loci Influencing General Cognitive Function Large GWAS demonstrating highly polygenic architecture and modest individual prediction.
- MedlinePlus Genetics — Is Intelligence Determined by Genetics? Consumer genetics summary emphasizing no single major intelligence gene.
- NHGRI — Chromosome Explains that children inherit half their chromosomes from each parent.
- MedlinePlus Genetics — What Is Heritability? Clarifies that heritability is a population statistic, not individual destiny.
- WHO — Nurturing Care for Early Childhood Development Health, nutrition, security, responsive caregiving and early learning framework.
- WHO — Iron Deficiency and Brain Development Importance of detecting maternal and early-childhood iron deficiency.
- WHO — Iodine in Pregnancy and Lactation Iodine and thyroid hormones in fetal brain and nervous-system development.
- CDC — Lead Exposure Symptoms and Complications Lead-related harm to brain development, IQ, attention and school performance.
- CDC — About Folic Acid Folic acid and prevention of neural-tube defects before and during early pregnancy.
- CDC — Alcohol Use During Pregnancy Prenatal alcohol exposure and lifelong behavioral, intellectual and physical disability risks.
- AAIDD — Defining Criteria for Intellectual Disability Intellectual and adaptive-functioning criteria.
- Pearson — WISC-V Official publisher guidance describing child composite scores relative to same-age peers.
- Pearson — WAIS-5 Official publisher information for a current adult intelligence battery.
- APA Dictionary of Psychology — IQ Definition of IQ and the historical mental-age divided by chronological-age ratio.
- Standards for Educational and Psychological Testing Validity, fairness, reliability and responsible testing standards.
- NHGRI — Eugenics and Scientific Racism Historical context and why simple hereditary claims about intelligence are scientifically inaccurate.
Image credits: Original diagrams in this package were created for this page. The Alfred Binet portrait and 1917 Army testing photograph are public domain. The David Wechsler photograph is credited to New York University School of Medicine and licensed CC BY 4.0 via Wikimedia Commons.